This is Not Your Mother’s Alpha
June 26, 2025
Historically, each drawdown in the NASDAQ has corresponded to a significant increase in venture return dispersion the following year.

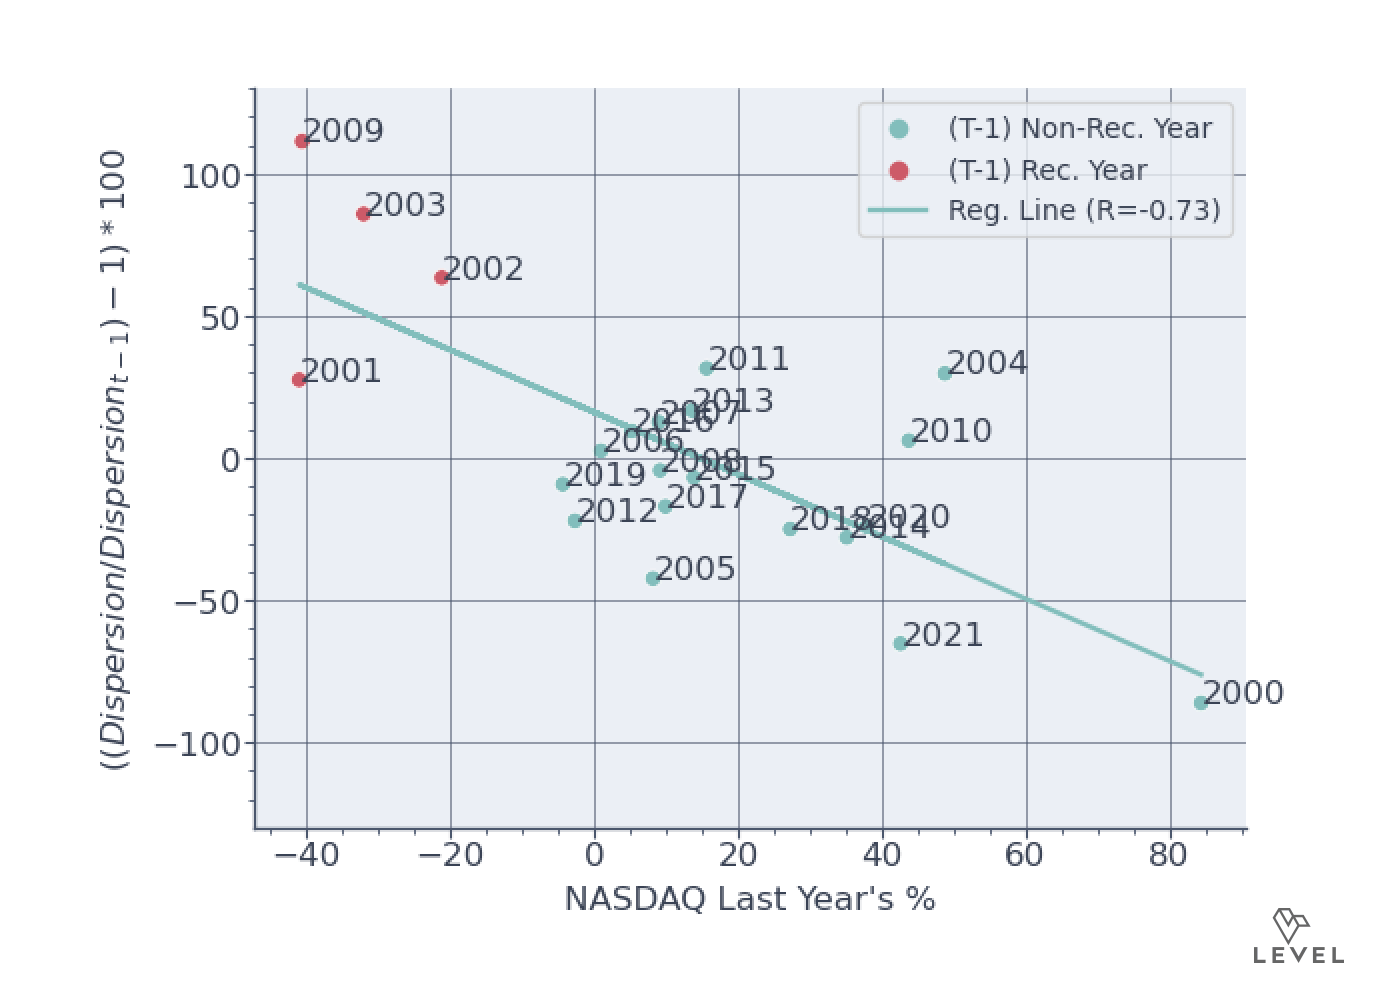
Pay attention to the regression line above. As you can see, the percentage change in a vintage’s MOIC dispersion correlates negatively with the prior year’s NASDAQ percentage change.
For example, the 2009 point in the upper-left corner of the chart signifies a noteworthy shift in venture capital returns. Specifically, following a sharp downturn in the NASDAQ in the previous year (2008), there was a marked rise in the dispersion of venture capital returns from the prior year to the present year (2009).
What could this mean for the 2023 vintage?
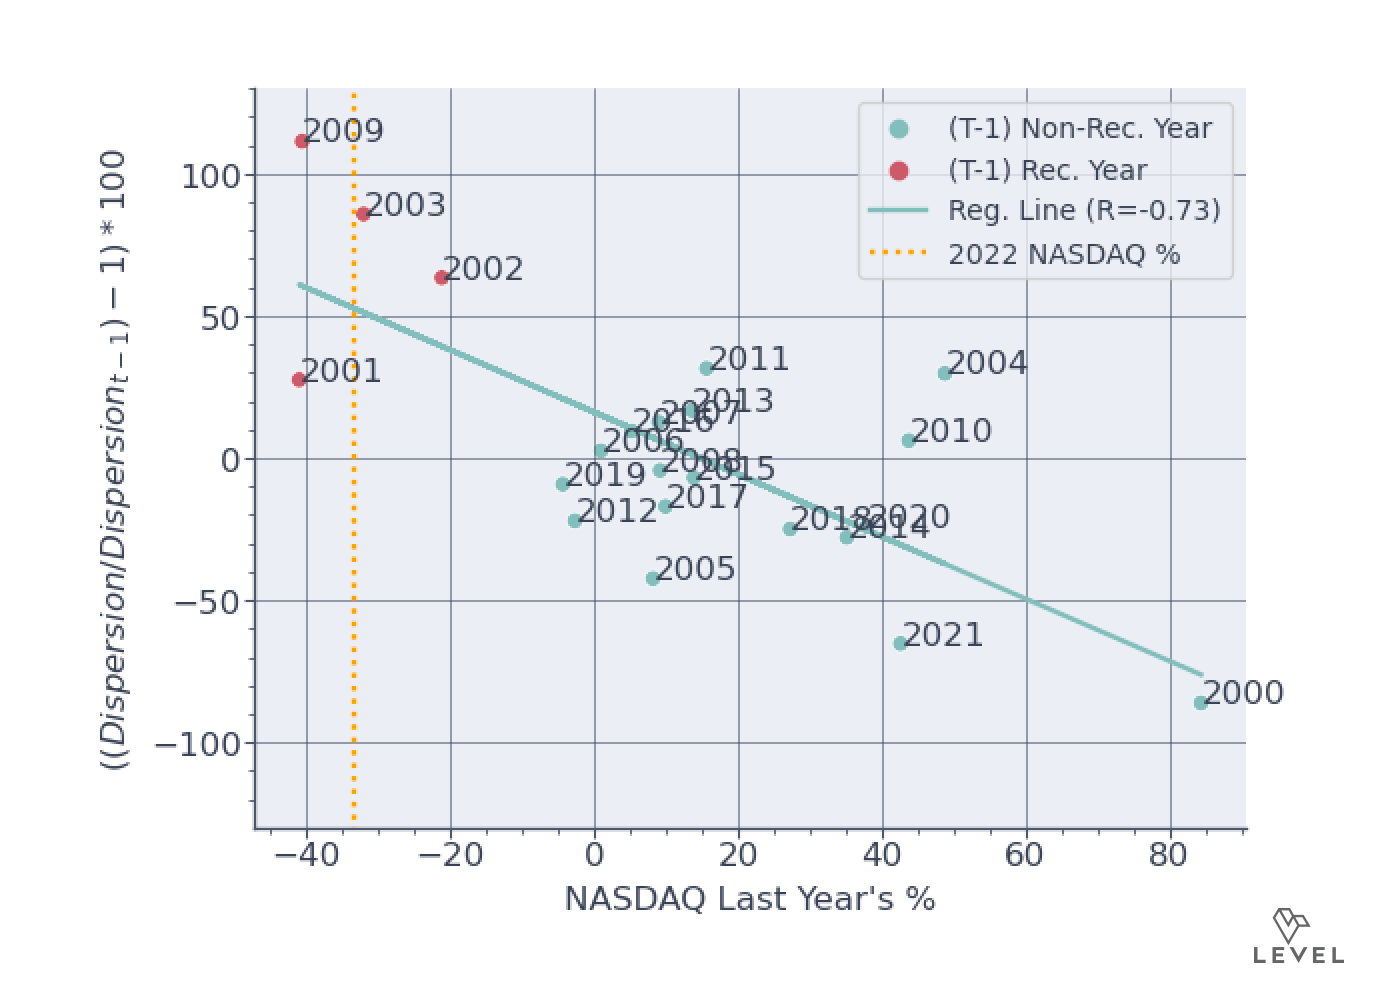
The orange dotted line above shows the NASDAQ’s change in 2022. If this trend continues, you can expect in the 2023 vintage, top-quartile managers will outperform the lowest-quartile managers by approximately 50% (intersection or orange and green line) from the year before it.
Supplements: