This is Not Your Mother’s Alpha
June 26, 2025
“It is not the strongest of the species that survives, nor the most intelligent that survives. It is the one that is most adaptable to change.”
— Charles Darwin, The Origin of Species
Historical data shows that venture capital fund of funds (FoFs) perform quite well (even after accounting for FoF fees), and often outperform direct VC fund investing due to most investors’ limitations around access and manager selection.
Indeed, FoFs in venture capital are particularly effective from a diversification and returns perspective due to the high dispersion in venture fund multiples.
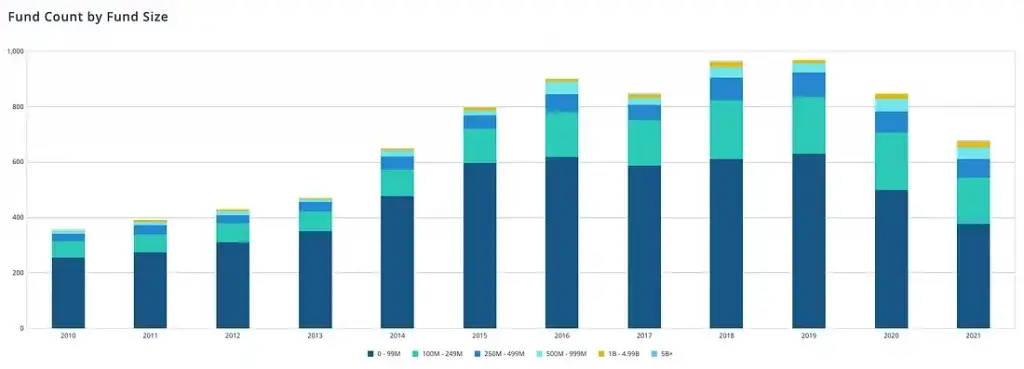
At the same time, the number and diversity of private equity/venture capital funds have created an ever more complex environment for Limited Partners (LPs) — and this complexity is more pronounced within the growing volume of venture capital seed managers, emerging managers, and micro VCs who have limited track records and opaque sourcing and investment processes.
It is also well-known, however, that these smaller venture capital funds are more likely to outperform larger funds. This is due to the skewed distribution of early-stage venture capital returns which are driven by outliers (see below). Successfully tapping into this sector of venture capital can drive major returns.
Investing in such a rapidly evolving landscape calls for a new approach.
FoF’s have clear benefits as an investment vehicle, but considerable improvements in data availability, data infrastructure/pipelining, and modern statistical learning (AI/ML) over the last several years enable a fresh take on the traditional model and a new opportunity for those who utilize these technologies successfully to their advantage.
At Level Ventures, we believe a modern, seed-focused FoF strategy that utilizes a quantitative, data-driven approach is a high-confidence method for achieving top-quartile returns in venture capital with limited downside risk. It is our conclusion that the benefits of FoF intermediation (diversification, manager selection, access, etc.) outperform other methods and is an optimal strategy for LPs who want broad-based exposure to the venture ecosystem.
Our approach is built on the following tenets and aims to generate returns above the top-quartile of venture fund benchmarks:
“A lesson inherent in any probabilistic exercise: the frequency of correctness does not matter; it is the magnitude of correctness that matters”
— Michael Mauboussin
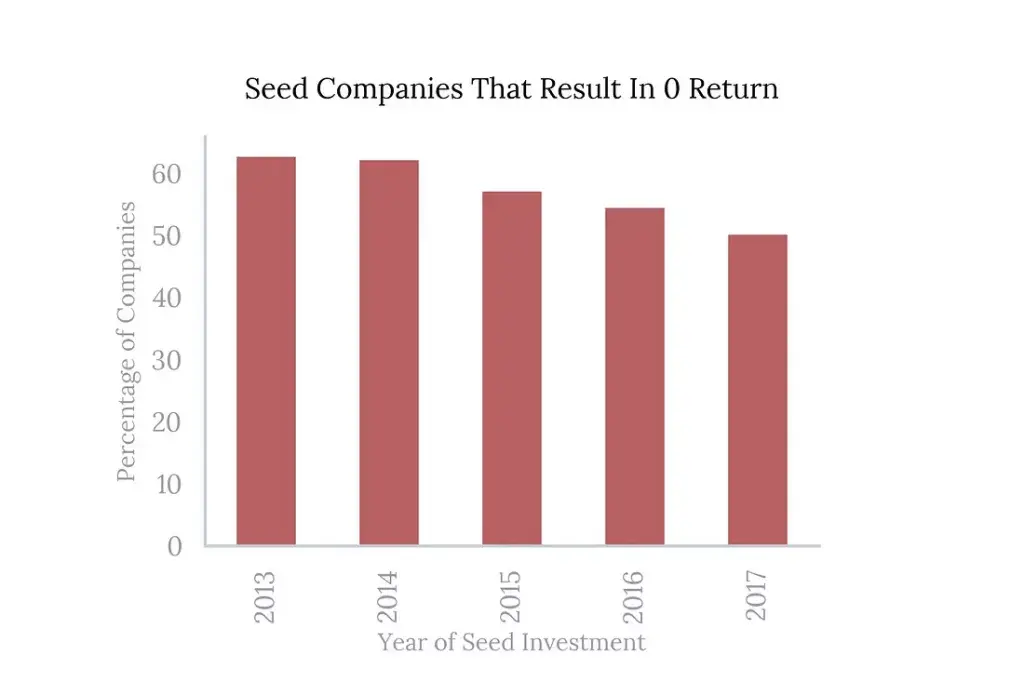
Seed venture capital investments are inherently risky, with over 50% losing principal.
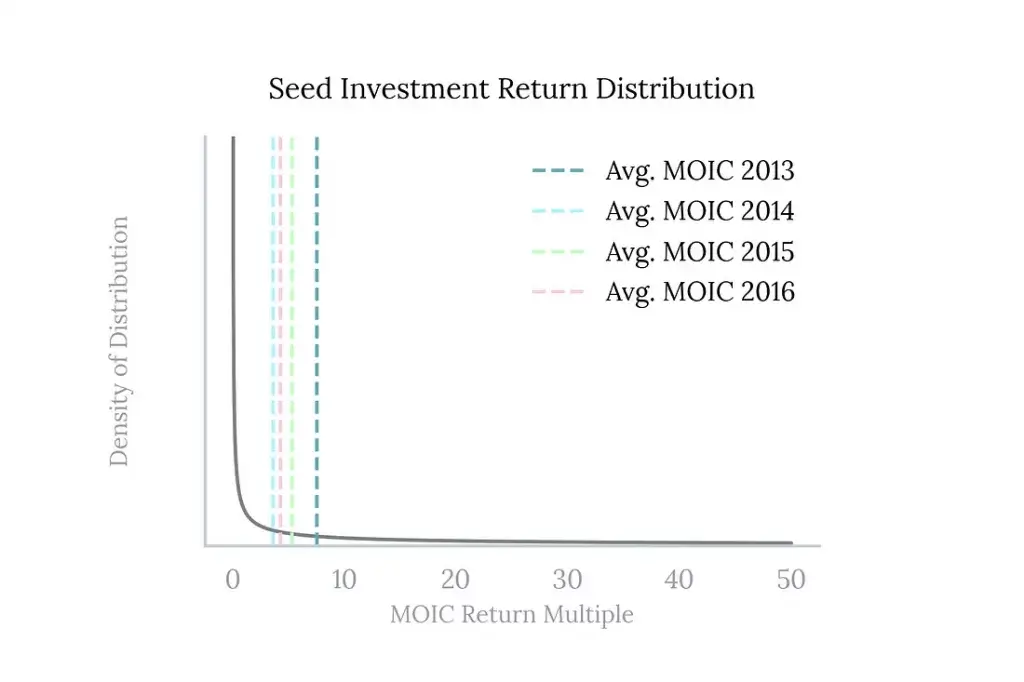
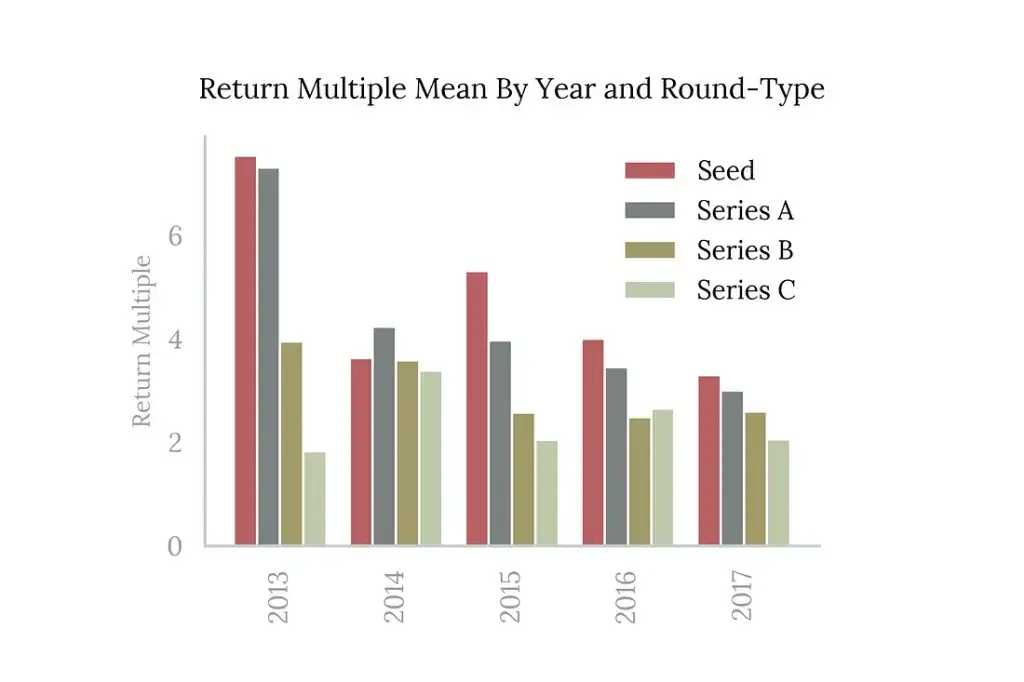
However, in aggregate, seed-stage investments perform quite well. Boosted by outliers in the tail of the Power Law distribution, the expected return of a seed investment is approximately 5x, based on investments made in the 2013–2016 vintage.
Below you can see the annual average estimated return on invested capital (the horizontal dashed bars). The underlying (fitted) return distribution is heavily skewed, implying a long-tail of potential outlier returns.
Similar to seed investments, Series A investments have also consistently delivered high expectations. But note that seed funds, utilizing fund follow-on reserves, often take advantage of their pre-emptive rights in breakout companies to capture both the high seed and Series A multiples.
Plotted below is the estimated return on investment capital distribution for all venture capital firms (left) and for venture capital firms with at least 60% of their portfolio companies entered at the seed round (“seed entrances”). As you can see, firms with a majority of seed entrances have a higher return variance as the portfolios mature (for instance, the 75th percentile return for a 2012 seed venture capital firm is close to 11x).
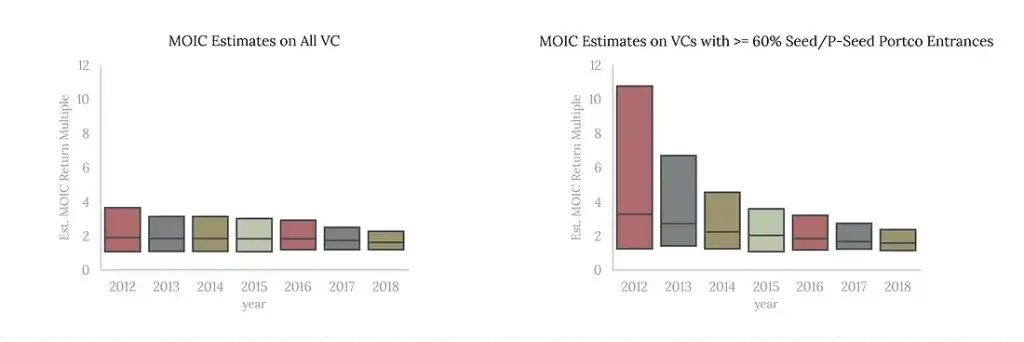
Clearly, it is ideal for an investor to select the top-quartile seed VC fund managers in a (real or synthetic) FoF approach.
“We show that VC FoFs often outperform direct investing... In addition, given the highly-dispersed nature of direct fund returns in venture, VC FoFs create more risk reduction through diversification”
— Harris, Jenkinson, Kaplan, and Stucke
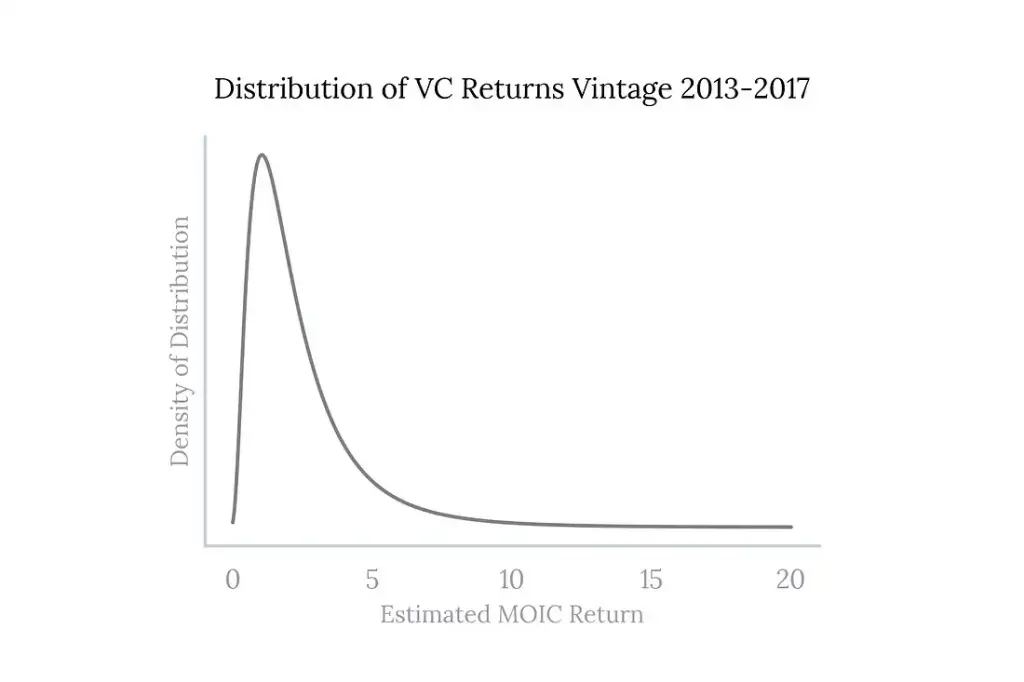
At Level, we took an even closer look at the return distribution for venture capital funds. We found that fund returns are also skewed and closely follow a log-normal distribution.
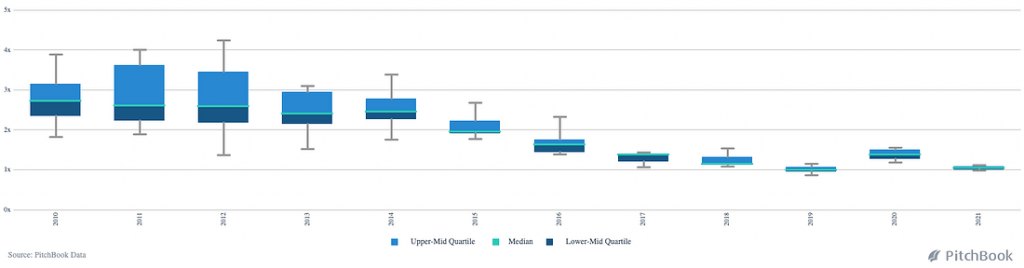
We can also analyze the distribution as a box plot to see that from 2013–2017 the median return (non-inclusive of fees) is close to 2x, while the 75th percentiles is close to 3x. Not shown on the box plot is that the 90th percentile is >10x.
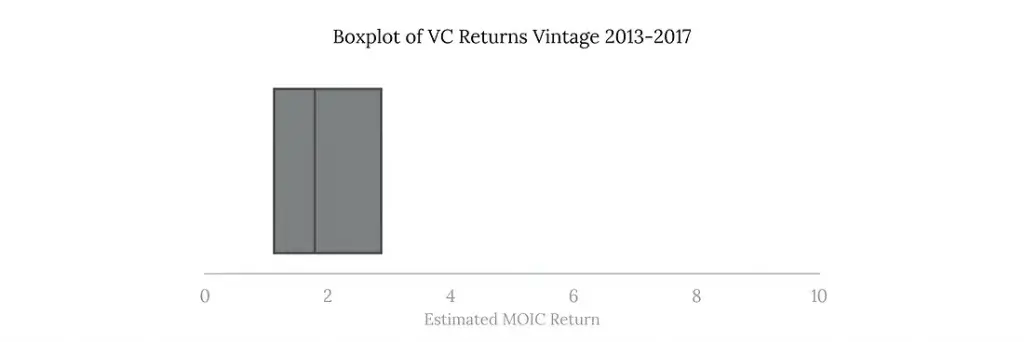
As emphasized by the chart above, the variance and skewness of venture fund outcomes is very pronounced. In other words, the difference in performance between the 75th percentile (right-most vertical black line) and 50th percentile (middle vertical black line) is vastly larger than the difference in performance between the 50th percentile and 25th percentile (left vertical black line).
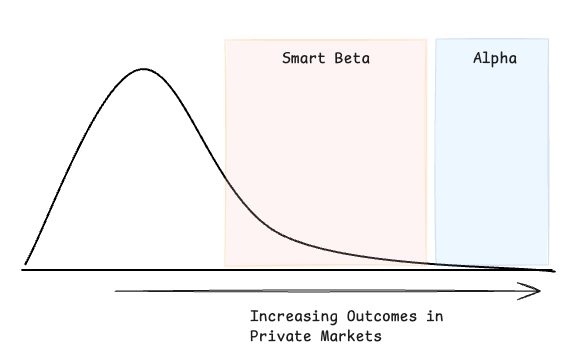
But what we find more intriguing about this distribution is that by sampling from the top half of venture capital funds, we achieve above-top-quartile returns (see the red horizontal bar the graph below). That is, the mean of the two top quartiles in venture performs above the top quartile.
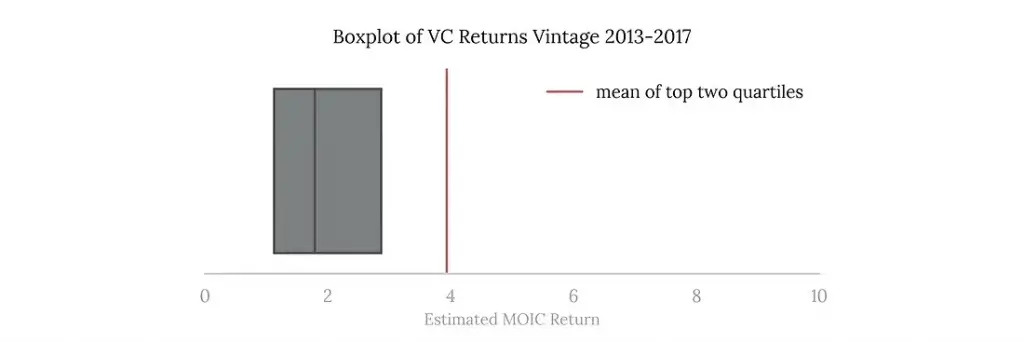
Breaking this down further: outlier high-return funds (think long-tail) drive the mean of the top half above the 75th percentile line. Thus suggesting that one way to achieve above-top-quartile returns is to develop a (high probability) strategy that can continuously sample from the top half of venture capital funds.
However, this objective is difficult to achieve in practice, due to the sheer number of firms, limited fund track records, vintage dependency, portfolio construction variations, opaque sourcing and investment processes, access limitations, etc. This is why we developed a tech-driven, quantitative approach to positively bias fund selection and achieve top-quartile return expectations.
“There’s a way to do it better — find it.”
― Thomas A. Edison
At Level we couple the traditional investment firm/fund diligence process with a novel quantitative, data-driven technique. A data-driven strategy is feasible today due to the large amount and resolution of private market transactional data now available.
At Level, we ingest multiple data sources, including proprietary fund data and market data (market prices, crypto prices, etc), to power our core fund prediction models. Without getting too deep in technical details, our models are built on simple intuition: the key factor in a seed firm’s future success is their ability to serve as an early signal for (successful) downstream investors.
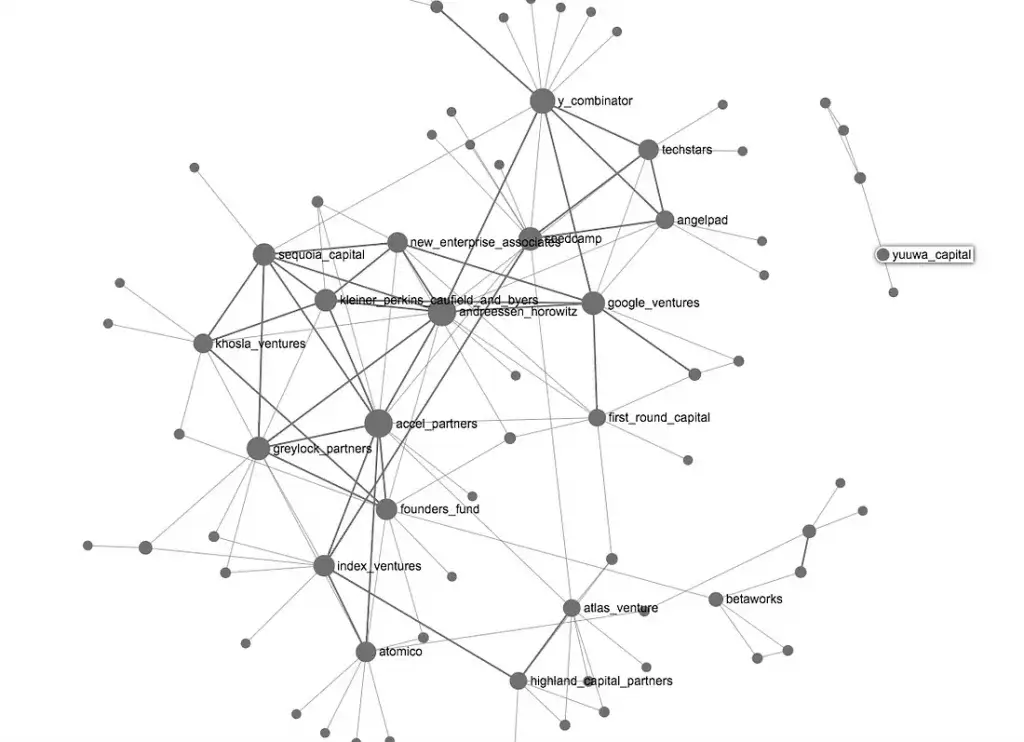
Our method constructs highly specialized (co-investor/affiliation) network graphs and subsequently runs algorithms on top of these graphs to generate predictions (graph-based learning) in the form of fund manager scores. We believe this specialized network approach unlocks a level of visibility beyond fund manager portfolios/track records and is well-suited for venture capital (where deal syndication is frequent).
In a later post, we will go deep on our graph-theoretic algorithms and provide some details and metrics on the networks constructed.
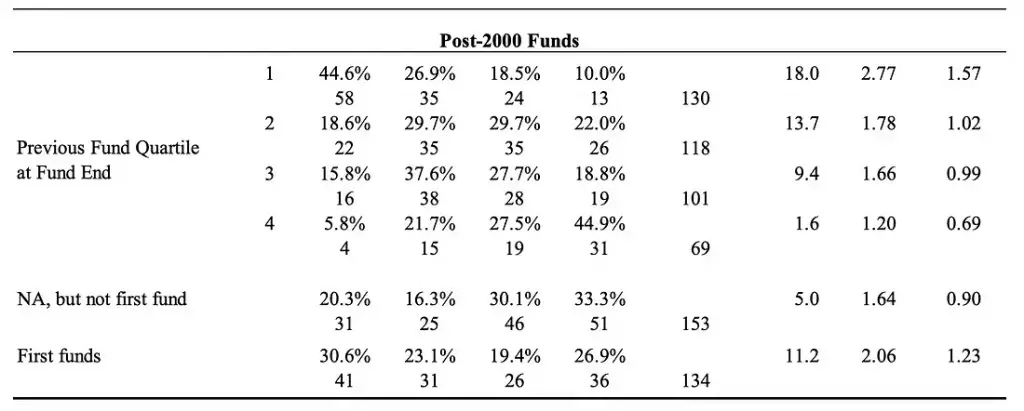
In our backtesting studies, our top scored firms perform above the top-quartile and median 65% and 85% of the time, respectively. This performance is significantly better than using track record alone as an indication of future performance (note also that prior fund track records are often early at the time when firms raise subsequent funds). Of course, we also positively bias our models with rigorous diligence, sector focus, geography, etc.
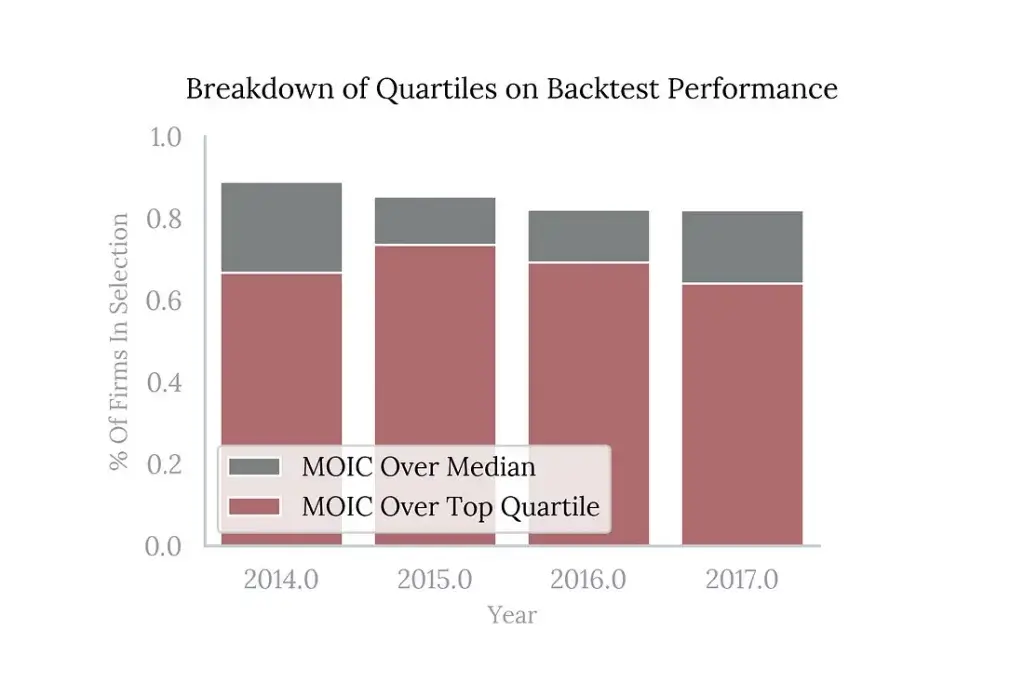
That is, our quantitative approach outperforms the common practice which uses track record alone as an indication of future performance. The study below estimates top-quartile persistence as 44.6%.
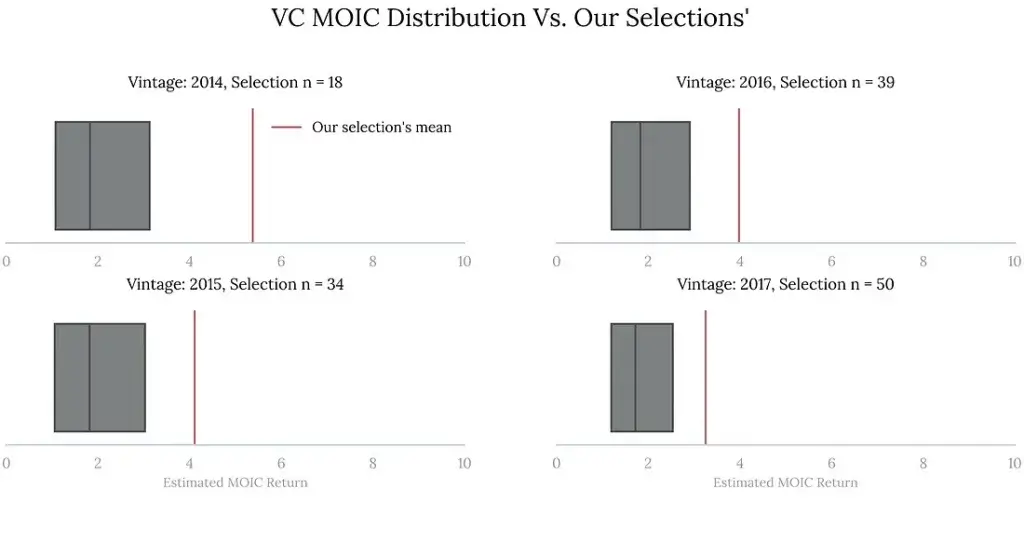
Even more exciting is that the mean of our pure algorithmic segmentation consistently outperforms top-quartile returns. Below, we show the mean return in our backtest fund selection against the distribution of all venture capital returns for vintages 2014 through 2017.
To summarize, we believe a seed-focused venture capital FoF model is an optimal investment strategy to gain exposure to venture capital returns in a risk-managed way. This strategy benefits from a quantitative approach that accurately samples from the top-half of venture capital firms to achieve above top-quartile returns.
At Level Ventures, we have launched a next-generation FoF aimed at deploying the most advanced technology to access top-quartile seed funds globally and co-invest alongside/support these funds into their high-growth companies. In the future, we are planning to launch several data-driven products aimed at providing investors with global, diversified exposure to technology innovation.
You can also view this post on Medium here.